FOR 22 YEARS
| Weekend Gross | Total Gross | Weeks on chart | % diff last week | |||
|---|---|---|---|---|---|---|
| 1. |  |
Trading Places |
£515,060 | £515,060 | New | |
| 2. | 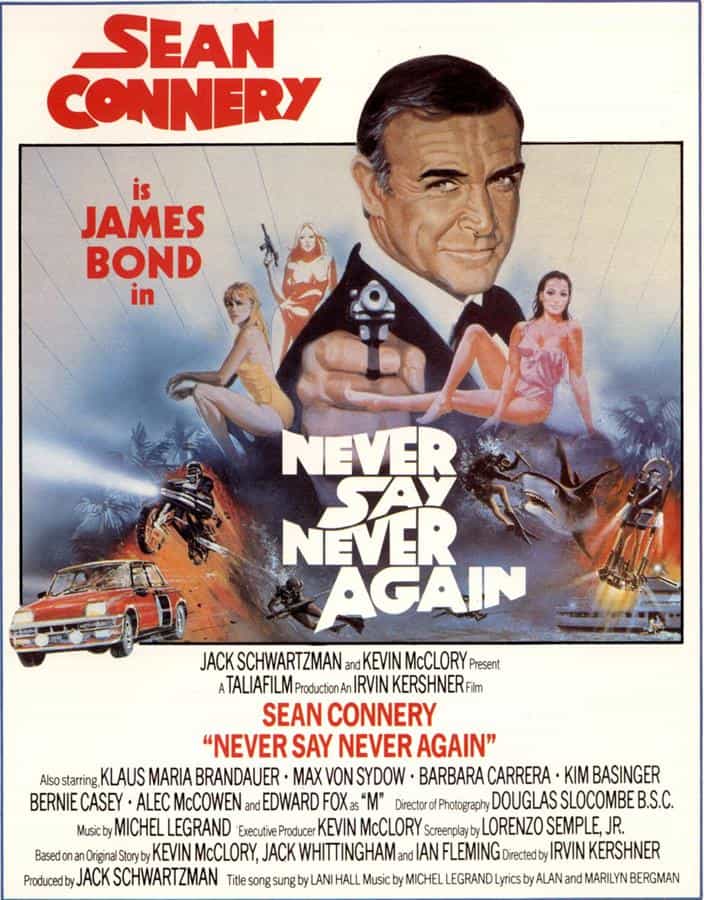 |
Never Say Never Again |
£275,793 | £2,982,972 | 5 | -17% |
| 3. |  |
Curse of the Pink Panther |
£154,699 | £417,687 | 2 | -29% |
| 4. | 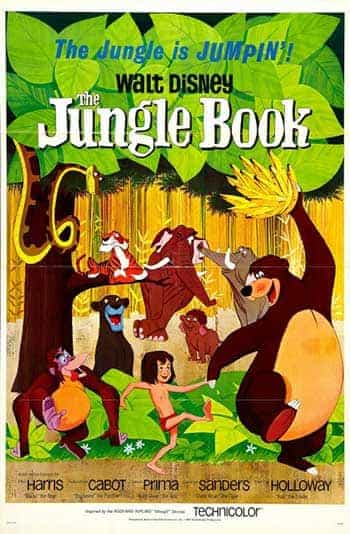 |
The Jungle Book |
£69,207 | £2,488,705 | 8 | -23% |
| 5. | 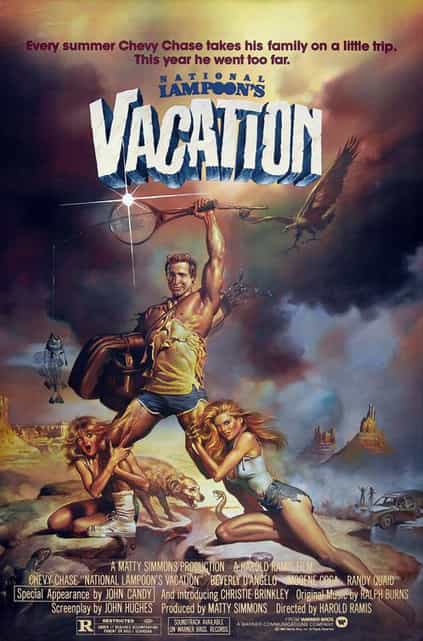 |
National Lampoons Vacation |
£43,836 | £2,985,933 | 8 | -17% |
| 6. | |
The Osterman Weekend |
£23,409 | £581,394 | 6 | -47% |
| 7. | |
Videodrome |
£14,653 | £81,472 | 3 | -17% |
| 8. |  |
Staying Alive |
£9,000 | £2,474,795 | 12 | -56% |
| 9. | |
Class |
£4,831 | £999,538 | 8 | -52% |
| 10. | |
Zelig |
£2,864 | £835,947 | 10 | -38% |
| 11. |  |
WarGames |
£1,114 | £2,182,103 | 17 | -52% |
Please contact 25thfame.co.uk if you think this chart is not an acurate representation and have more up to date information.